Climate Dashboard update: measuring is knowing

What is the remaining carbon budget if we hope to limit global warming to 1.5 °C? How much will the transition to a net-zero economy cost? The NBB’s Climate Dashboard is a useful source of information for everyone concerned about climate change. As the saying goes, measuring is knowing and ideally knowledge leads to changes in behaviour and informed decisions.
The dashboard indicators can be divided into three main groups:
- Figures on greenhouse gas emissions and energy consumption, both globally and for Belgium. Here we can see which sectors and economic agents (companies and households) contribute the most to climate change and are therefore also exposed to risks associated with the transition to net zero.
- Data on the broader economic context. These range from the cost of various energy sources and the competitiveness of renewables to carbon prices and taxes.
- Indicators on sustainable finance, such as trends in green bond issuance, and climate-related financial risks to which financial institutions are exposed. These include both physical risks, like the impact of increasingly frequent droughts on the creditworthiness of farms, and transition risks, for instance due to abrupt changes in the regulatory landscape or the preferences of consumers and investors or technological innovation.
Greenhouse gas emissions and energy consumption
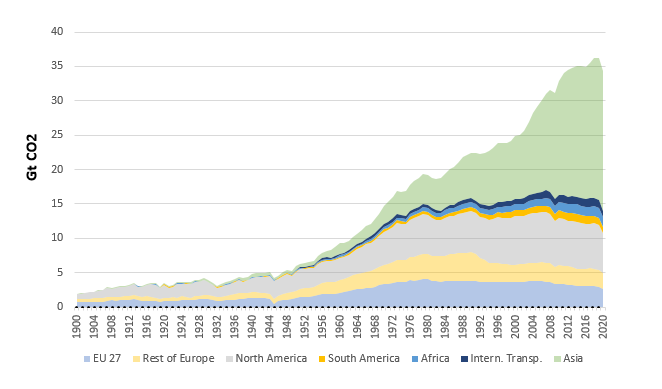
The dashboard shows that global greenhouse gas emissions continue to rise. At the current level of emissions, it will take less than 10 years to exhaust the remaining carbon budget to keep global warming below 1.5 °C. This is the limit set by the Paris Agreement as scientists agree that a higher temperature rise could have catastrophic consequences for society. It is becoming increasingly unrealistic to believe that we will be able to reverse the trend of rising emissions in time. The actual temperature rise will therefore most likely be more than 1.5°C. Rough calculations show, however, that the macroeconomic costs of the transition to net zero are manageable (see the NBB’s blog post of 6 June 2023).
It is unlikely that global warming can be limited to 1.5 °C.
Global CO2 emissions
Broader economic context
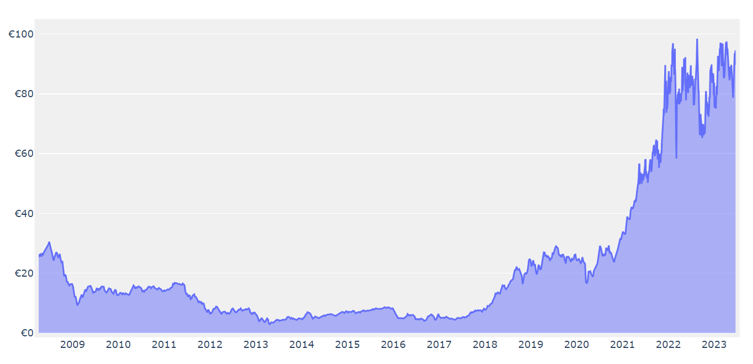
Carbon pricing is key to ensuring that low-carbon products and activities become cheaper than carbon-intensive ones, thus redirecting investment towards a decarbonised economy. Such pricing can take the form of an emissions trading system, in which the maximum permissible emissions over a certain period of time are capped (quotas). In this way, companies can trade emission allowances to offset their emissions. The EU’s emissions trading system covers the power, energy-intensive industrial (e.g. oil refining, steel, cement production) and domestic aviation (flights within Europe) sectors, which account for around 40% of the EU’s total greenhouse gas emissions. The remainder, including those from the construction, transport and agriculture sectors, is currently not covered by the ETS. However, the system will be expanded in the coming years to include emissions from buildings and transport.
EU emissions trading system - carbon price
Another form of carbon pricing is a carbon tax, which is charged on top of the sales price of goods and services, based on the level of greenhouse gas emissions. Carbon taxes vary widely from sector to sector. For example, carbon taxes for buildings and industrial sectors not covered by the ETS are very low in Belgium compared to other European countries.
Carbon taxes for buildings and industrial sectors not covered by the EU emissions trading system appear very low in Belgium
Sustainable finance and climate-related financial risks
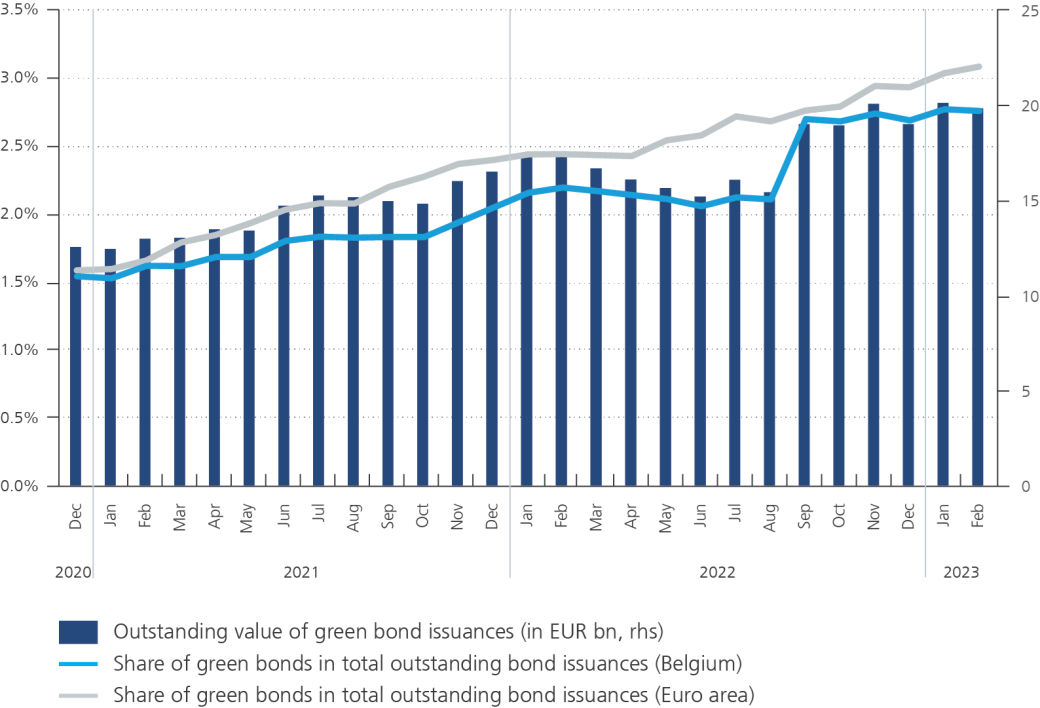
Additional charts on climate-related risks and green investments by financial institutions have been included in the latest version of the dashboard. These were created based on statistics released by the European Central Bank (ECB) since the beginning of this year (see the NBB’s blog post of 27 January 2023). These statistics show that although Belgian financial institutions and companies are issuing more green bonds, these issuances still represent less than 3% of the value of total outstanding bond issuances. Nonetheless, the carbon footprint of Belgian financial institutions’ securities portfolios at the end of 2020 was on average below that of all financial institutions in the euro area. Sectors or firms with a high carbon footprint are considered to have high transition risk as they are more exposed to new policies and changes in technology and market preferences aimed at achieving greater sustainability. Finally, it appears that real estate, more specifically the energy inefficiency of buildings, is the main source of transition risk for Belgian financial institutions.
Outstanding value of green bond issuances in Belgium
Data on the financing of emission reductions by the financial sector are still lacking
To be continued
Subsequent versions of the Climate Dashboard will include more and more information. Indeed, a lack of useful data has been consistently identified as one of the main bottlenecks to assessing the impact of climate change and the net-zero transition on the economy and the financial system.
Companies and financial institutions are working hard to collect more data in this field, which they are also increasingly required to publish. The data that companies release is important to financial institutions. After all, the latter finance companies by lending them money or purchasing securities from them and are thus exposed in turn to the same climate-related risks. Based on this information, it will be possible to supplement the Climate Dashboard.
Data that are still missing - and on which we would like to publish more information in the future - include detailed data on the exposure of companies and financial institutions to physical risks. Think of flooding due to extreme rainfall or droughts, for example. The first such data collected by the ECB for the financial sector appear to indicate that the exposure of Belgian financial institutions is limited in the short and medium term. However, it should be borne in mind that these indicators are still incomplete and do not sufficiently take into account future developments.
Data on the financing of emission reductions by the financial sector are also still lacking. Transition risk indicators tend to focus on measuring exposure to emission-intensive companies and sectors, without factoring in any plans these companies might have to reduce their emissions. The financing of such emission reductions is however an important lever in supporting the transition and mitigating climate risk.
The Climate Dashboard is prepared by the Climate Hub, the body within the NBB responsible for coordinating initiatives on climate change and sustainable financing. In this way, the National Bank of Belgium seeks to better inform the general public of the economic and financial consequences of climate change and the transition to a net-zero economy. The dashboard also provides information on how the real economy and the financial sector contribute to climate change and the climate transition.