The perils of tracking year-on-year inflation

The main objective of the European Central Bank (ECB) is to steer year-on-year inflation in the euro area to 2% in the medium term. In response to high inflationary pressures during the post-COVID economic recovery, the ECB had to raise interest rates rapidly to cool down the economy. When will the ECB stop raising interest rates? This decision will depend, amongst other factors, on incoming economic data. This is also what NBB governor Pierre Wunsch said in a recent TV interview.
At face value, the news that year-on-year inflation in the euro area had dropped from 8.5% in February to 6.9% in March would appear to signal a quick return to 2%. However, year-on-year inflation figures have been criticised for attaching too much weight to price changes from a year ago. This blog post looks at this critique and discusses alternative measures of inflation.
The key takeaways are:
- The strong drop in year-on-year inflation in March reflects price changes from a year ago rather than current developments.
- Alternative and more timely measures of inflation indicate that price pressures remain elevated, meaning restrictive monetary policy should be continued.
Year-on-year inflation: a distorted signal?
Discussions of inflation typically focus on the year-on-year inflation rate. This measure represents the percentage growth in the consumer price index (CPI) for the current month compared to the same month one year ago.
It is useful to compare this measure to the month-on-month inflation rate, which is the percentage growth in the CPI for the current month compared to the previous month. In fact, year-on-year inflation is an average of the month-on-month inflation rates over the past year. (For more detailed information, see the mathematical notes at the end of this post.) This means that, in this measure of inflation, month-on-month inflation observations from about a year ago have the same impact as the current month’s data.
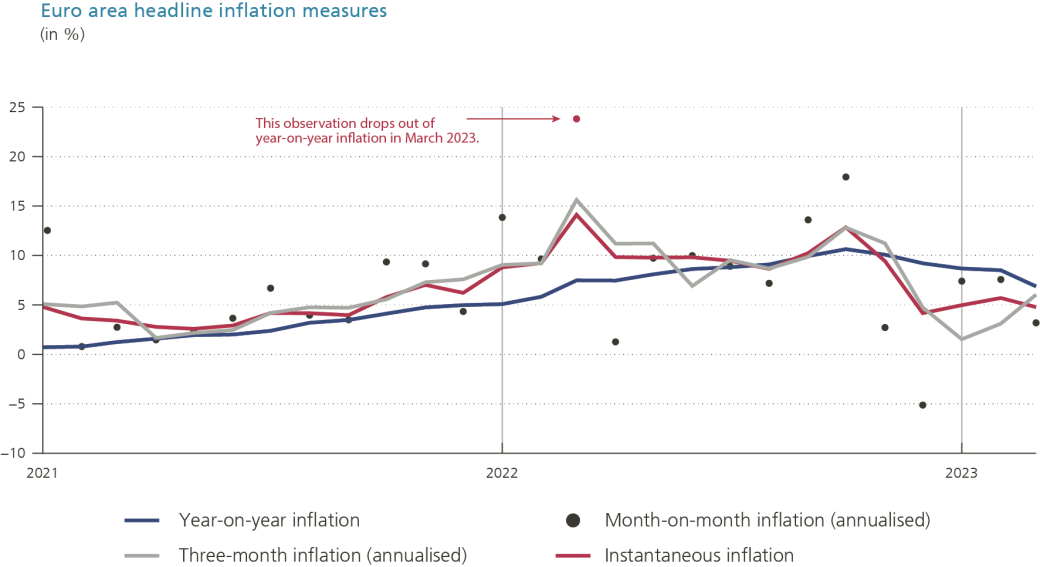
Chart 1 compares month-on-month and year-on-year inflation in the euro area since 2021. As can be seen, month-on-month inflation (black dots) is very volatile. This volatility is mainly driven by rapid price changes for energy and food. From a monetary policy perspective, this means that month-on-month inflation provides “noisy” signals on the trend in current price dynamics.
By contrast, year-on-year inflation (blue line) is much smoother because it averages month-on-month inflation over 12 periods. However, this averaging comes at a cost as it assigns equal weight to monthly outcomes from further in the past. For example, the year-on-year inflation rates for February and March 2023 have eleven month-on-month observations in common (April 2022-February 2023). The only difference between the two is that the month-on-month observation from March 2022 is replaced with that of March 2023. Therefore, looking at this metric, the news content of a release of new inflation figures will be limited.
Moreover, observations from a year ago can be disproportionately influential. As it turns out, month-on-month inflation was at an all-time high in March 2022. Following Russia’s invasion of Ukraine at the end of February 2022, energy prices surged the following month. The drop in the March year-on-year inflation rate is thus significantly driven by the removal of an older - and high - month-on-month inflation figure! This example illustrates why the use of year-on-year inflation to signal the current pace of price changes has been criticised.
Chart 1
Certain alternative inflation measures give more weight to recent data
Does this mean that we should never look at year-on-year inflation? Not at all. For example, year-on-year inflation is perfectly suitable for calculating the inflation-adjusted (or “real”) rate of return on one’s savings accounts over the past year. However, this measure of inflation may not be ideal when it comes to studying current price dynamics. On the other hand, month-on-month inflation provides timely signals but is very volatile.
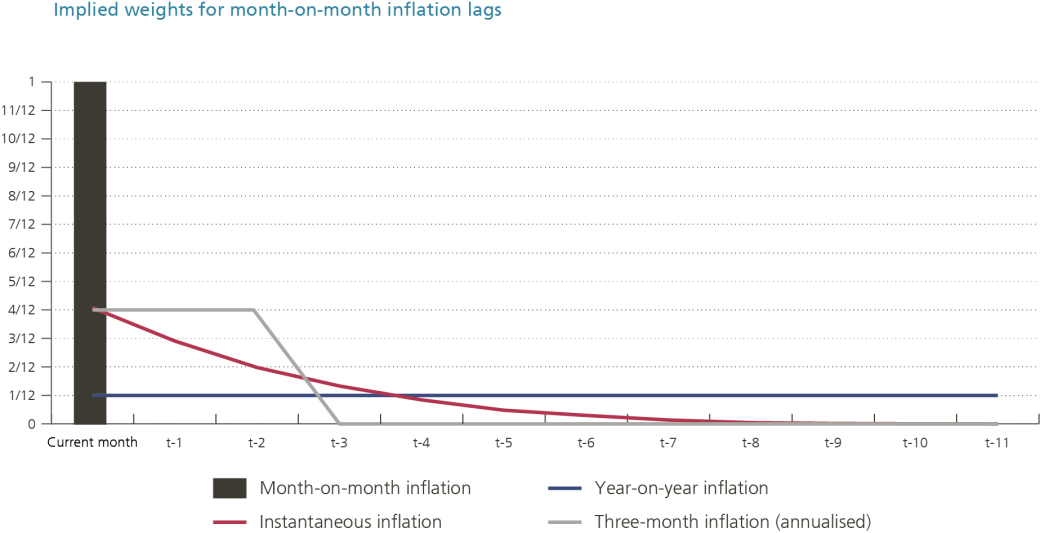
To strike a balance between timeliness and volatility, it’s possible to construct an inflation measure that doesn't place all of the weight on current month-on-month inflation but, at the same time, limits the weight attached to older price changes. Chart 2 illustrates how four inflation measures can be constructed (or reconstructed) by averaging month-on-month inflation rates from eleven months ago (time t -11 up to the current month (time t) using specific weights.
While month-on-month inflation considers the current month’s data only, year-on-year inflation represents an average of twelve consecutive observations, each of which weighs 1/12. In addition, two alternative measures are shown as intermediate cases. The first is three-month inflation (grey line), which weights the current and past two month-on-month inflation rates by one-third and ignores other lags. The second is “instantaneous inflation” (red line), a measure recently proposed by Professor Jan Eeckhout (Pompeu Fabra University). In its standard calibration, this measure assigns the most weight to current month-on-month inflation and gradually decreasing weights to further lags.
Chart 2
These two alternative inflation measures display similar dynamics (Chart 1). Over the past four months, both series have been below year-on-year inflation, indicating lower current price trends than the past year's average. Nonetheless, they are still above 2% and do not show a downward trend, indicating that price pressures remain high.
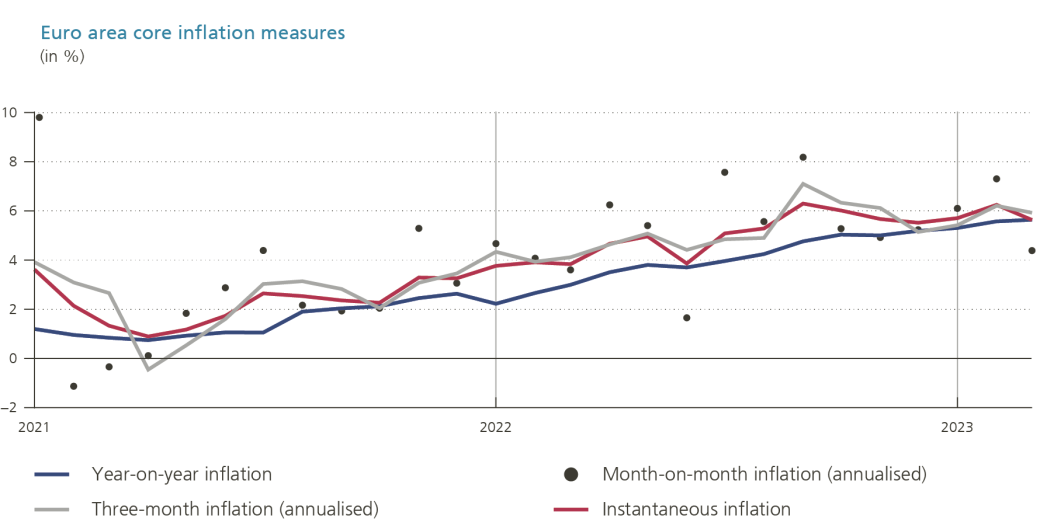
This finding also holds for core inflation (Chart 3). Unlike headline inflation, core inflation does not contain the energy and food components, which results in much less volatile month-on-month inflation rates. Since 2021, these rates have trended upwards. Consequently, year-on-year inflation and the alternative inflation measures remain high and do not indicate a downward trend to 2%.
Chart 3
Conclusion
In a recent TV interview, NBB governor Pierre Wunsch emphasised the importance of incoming inflation data for the next ECB decisions on interest rates. This blog post explains why inflation measures other than year-on-year inflation can be useful in this context.
Specifically, the March data illustrate how year-on-year inflation can send a distorted signal of current price pressures. Alternative measures show that current inflationary pressures remain high and display no downward trend. Therefore, the latest inflation data suggest that monetary policy should remain restrictive for the time being to bring headline inflation back to its 2% target.