Coronavirus crisis is having a heavy impact on some households’ income, bringing even bigger losses for low-income families
On account of the coronavirus crisis, some households, and especially those composed of self-employed, temporarily laid-off and student workers, have suffered hefty income losses. What is more, these losses are greater for those on low incomes. This is one of the findings to emerge from a large-scale online survey carried out between 7 and 24 May by the National Bank of Belgium (NBB), in cooperation with Microsoft Innovation Center.
The negative impact of the coronavirus crisis on household income has been largely offset by the operation of the automatic stabilisers, themselves reinforced by specific measures government to help salaried workers and the self-employed. In its spring projections published last week, the NBB nevertheless estimated this impact at around 2 percentage points for the year 2020 (roughly € 5 billion for the total population). It should be pointed out, however, that this macroeconomic estimate is just an average for the whole population, while it has become clear that some specific categories of the population have seen their income fall even more.
To get a better understanding of these income losses, a large-scale online survey was held. In all, 5 688 people responded to this survey, which enabled a series of unique findings to be gleaned from it[1]. It also provides more insight than other more general information such as obtained as part of the NBB’s monthly consumer survey.
Certain categories of workers have been hit badly by the coronavirus crisis
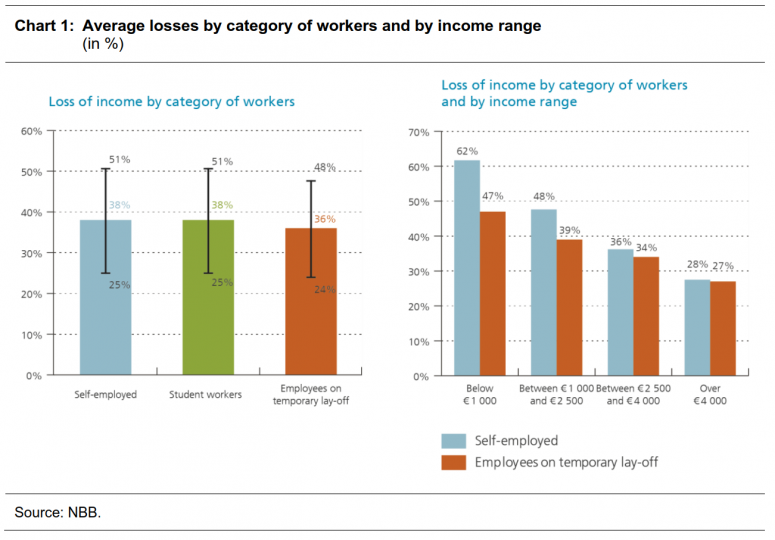
An initial finding to be drawn from replies to this survey is that households whose respondents identify themselves as self-employed, on temporary lay-off or students workers are incurring, on average, hefty income losses, in excess of 30 %, on account of the crisis triggered by the COVID-19 pandemic. The scale of these losses should nevertheless be interpreted with caution. The survey response options for this question were actually expressed in the form of ranges, i.e. "no loss of income", "less than 10 %", "between 10 and 30 %", "between 30 and 50 %" and "over 50 %". Average losses, estimated here by taking the average figure for these income loss ranges weighted in proportion to the number of replies, may therefore carry some margin of error. So, by only taking into account the lower or higher thresholds of these replies, the figure for this average loss may be lower or higher. By way of example, the confidence interval for households whose survey respondents identify themselves as self-employed is 13 percentage points above or below an average loss estimated at 38 %.
It should also be pointed out that these income losses refer to the average net income at a precise moment in the crisis, when the lockdown restrictions were tighter (i.e. when a lot of business activities were curtailed or stopped altogether), so they are not an estimate of the loss of income for a whole year. The gradual recovery of economic activity to a situation comparable to that before the crisis, and thus to a gradual return to normal of earned income – provided there are no bankruptcies or job losses –, should therefore result in a much more limited drop in income for the whole year. So, the relatively high income losses for certain specific groups, at a given moment in time, are not necessarily incompatible with the estimates made in the NBB’s June 2020 macroeconomic projections. And lastly, the losses reported in this press release refer to those for the respondent’s whole household, which implies in particular that the financial situation of a partner in the home can affect the results significantly.
Heavy loss of revenue in low-income households faced with high temporary unemployment
A second finding from this survey is that average losses are particularly significant for the lowest-income households who seem to be suffering much more from the repercussions of the coronavirus crisis, regardless of the occupational status of the respondent.
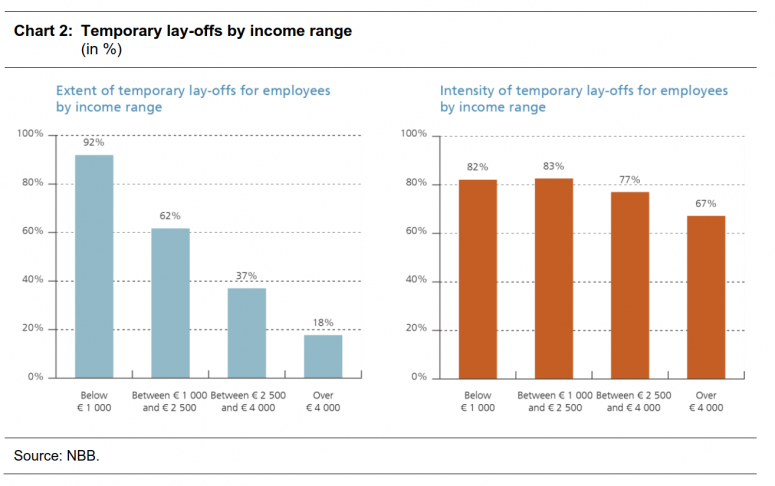
This observation applies in the first instance for households whose respondents identify themselves as being on temporary lay-off. While, theoretically, the replacement rate is higher for the lowest incomes because it is capped – which means that their relative income loss is, in principle, more limited –, the survey shows that the higher the income earned, the lower the loss for households whose respondent is temporarily unemployed[2]. This observation is largely due to wider recourse to temporary lay-offs and more intensive use of the system in terms of the number of days per week for salaried workers belonging to the lowest-income households. One of the factors explaining this situation is that they tend to work more often in the sectors hardest hit by the crisis and which have resorted more to temporary lay-offs (arts, entertainment and recreation, catering and accommodation, tourism, non-food retail, etc.). At the opposite end of the spectrum, in the highest-earning households, respondents say they work more frequently in sectors that have been relatively spared by the crisis, notably the financial sector or information and communication. A similar observation can be made for self-employed people from financially less well-off households given that they also say they work to a larger extent in the sectors hit the most by the crisis.
The vulnerability of the lowest-income households is exacerbated by their low savings reserves
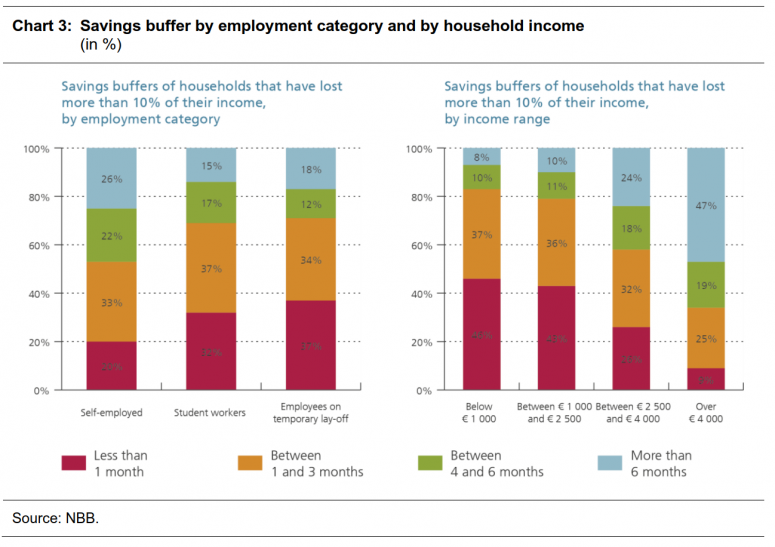
Over and above the average losses reported, households’ vulnerability can also be assessed through their ability to cover basis subsistence expenses (rent, shopping, etc.). In this respect, the analysis suggests that households whose survey respondents say they are self-employed generally tend to have a more comfortable savings buffer. Conversely, the lowest-income households are those that have a smaller savings pot to dip into to cope with a protracted reduction in their income.
Almost one-third of respondents have requested support owing to loss of income
This bigger hurdle encountered by the lowest-income households has also led to higher requests for help than for other categories of households, and especially when it comes to requests for assistance from public social assistance centers (CPAS). Requests to suspend mortgage repayments owing to the coronavirus crisis, although quite considerable too, are comparatively fewer than among the other income groups, which might be due to the fact that the proportion of homeowner households is lower among people on the lowest incomes.
Income losses are similar between the regions, although Flemish households appear less vulnerable in the short term
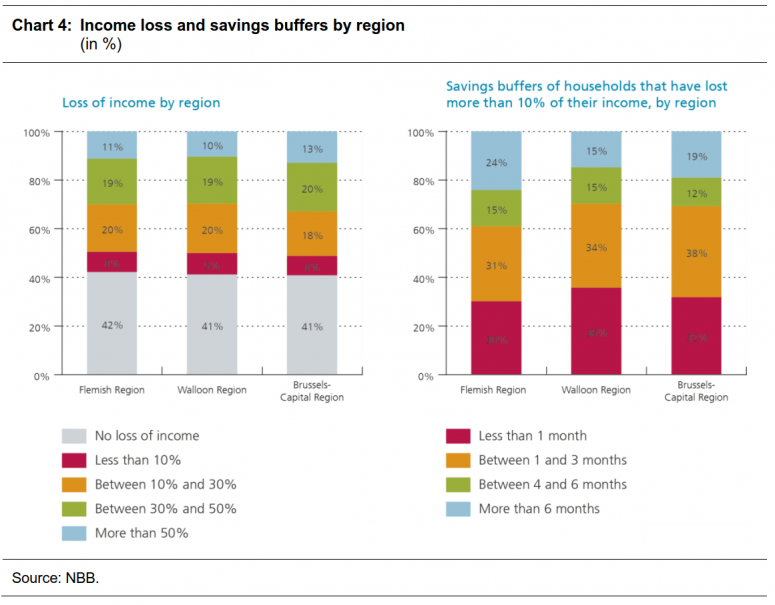
Declared income losses seem to be relatively comparable between Belgium’s three regions, with roughly 50 % of households indicating losses of over 10 %. However, in terms of vulnerability in the short term, Flemish households seem to have a more comfortable savings buffer. In the Walloon and Brussels-Capital regions, only one-third of households incurring a loss of over 10 % say they have a buffer of more than four months of savings to be in a position to cope with the drop in their income.
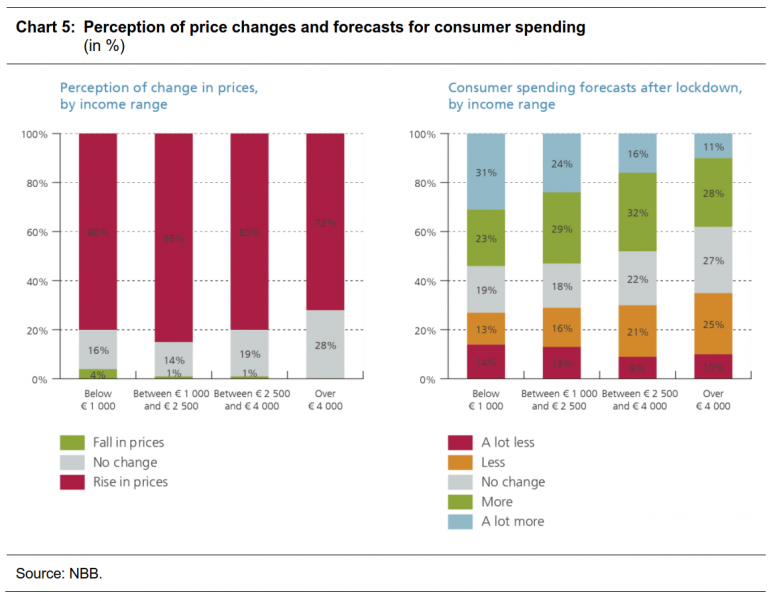
Lower-income households tend to report a perception of rising prices more frequently
Survey respondents reported price rises during the coronavirus crisis, and all the more so among low-income households. This could be explained by the fact they devote a larger proportion of their budget to the purchase of food items whose prices went up more during the lockdown.
Moreover, over half of these same households are planning to step up their consumption expenditure significantly in future. This situation could suggest that they have had to contend with greater liquidity constraints during the crisis, as indicated by the fact that the financial consequences of the COVID-19 pandemic have been relatively heavier for this category of households.
[1] Out of this total, account as not taken of 396 replies because the respondents were less than 18 years old and thus fell outside the scope of this survey, or because the replies given contained obvious inconsistencies. Those taking part in the survey replied on a voluntary basis, without the poll sample being composed beforehand.
[2] It should be noted that these replacement rates only include benefits from the National Employment Office. In reality, other elements may also influence the results, in particular the more frequent possibility for the highest-earning workers to benefit from compensation from their employer when put on temporary lay-off.